Statistics tests
1. Mean, SD, SEM, Skewness, etc.
1) Arithmetic, Geometric and Harmonic means
2) Standard Deviation (2)
3) Standard Error of the mean (sem)
4) 95 and 99% Confidence interval (CI)
5) Sum
6) Sum of Square
7) Variance, Unbiased variance
8) Coefficient of variation (%CV)
9) Skewness (2)
10) Kurtosis (2)
11) Graph
2. Median, Range, Quartiles and Boxplot.
1) Median
2) Maximum
3) Minimum
4) 1st Quartile
5) 3rd Quartile
6) Quartile Deviation
7) Graph
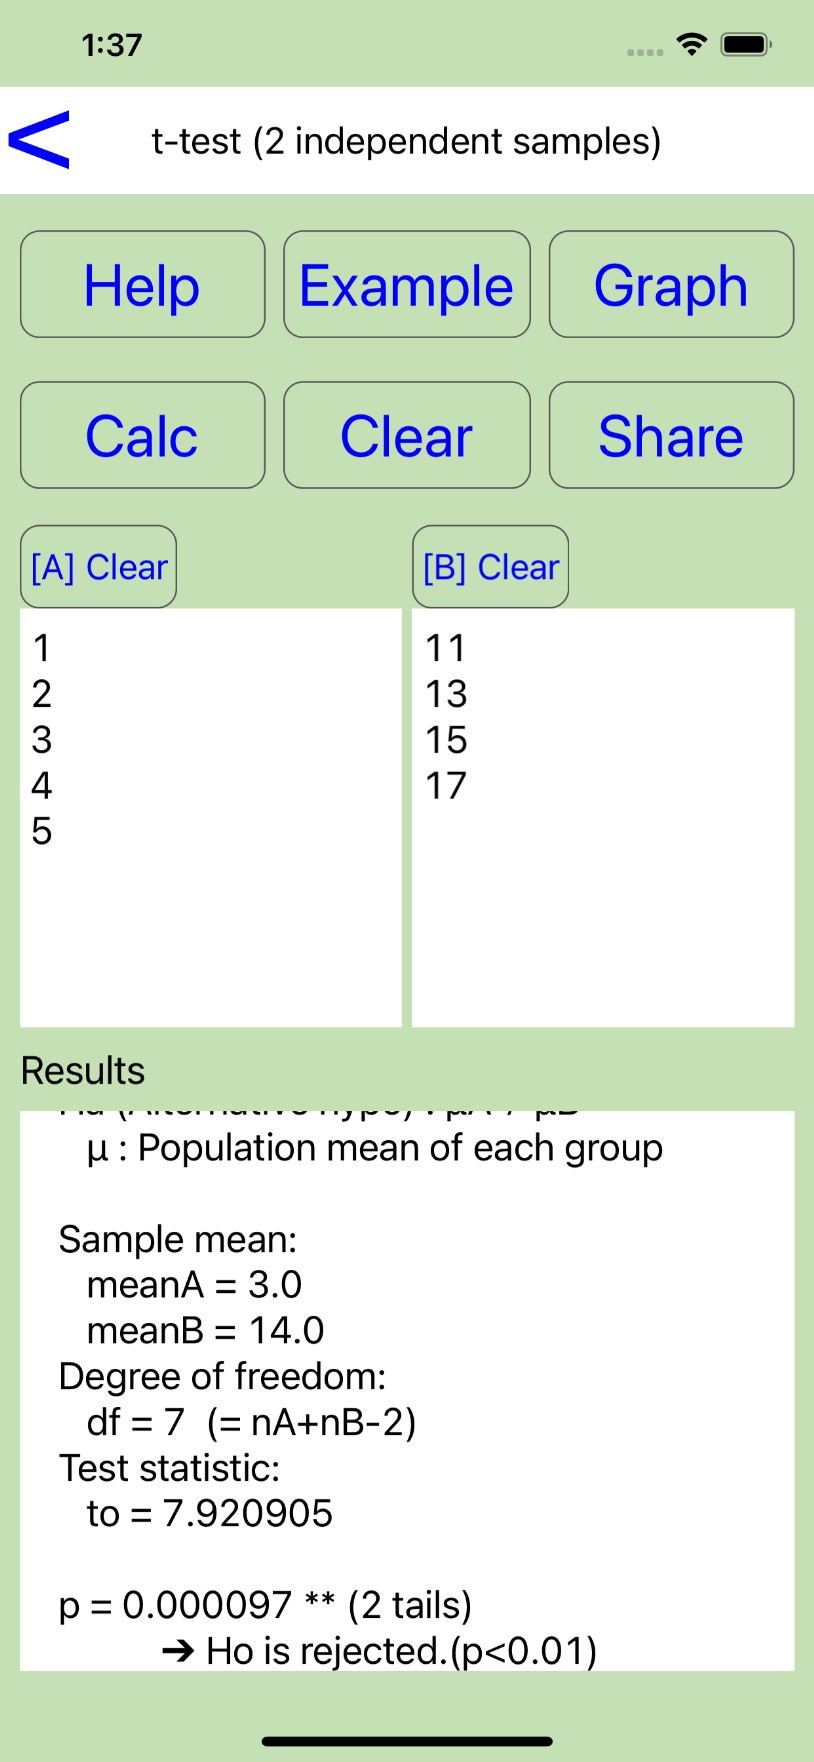
3. t-test (2 independent samples)
1) Mean
2) Standard deviation (2)
3) Standard error of the mean (sem)
4) F-test to compare 2 variances ➔ p value
5) Student t-test ➔ p value
6) Welch procedure ➔ p value
7) Graph
4. Paired t-test (Paired sample)
1) Mean
2) Standard error of the mean (sem)
3) Paired t-test ➔ p value
4) Graph
5. 1-Sample t-test (to compared mean)
1) Mean
2) Standard deviation (2)
3) Standard error of the mean (sem)
4) One-sample t-test ➔ p value
5) Confidence interval (CI)
6) Graph
6. 1-Way analysis of variance (ANOVA)
(Analysis of variance, 4 groups)
1) Mean
2) Standard error of the mean (sem)
3) Analysis of variance ➔ p value
4) ANOVA table
5) Graph
7. Test for Peason correlation coefficient & Linear Regression
1) Correlation coefficient
2) Regression coefficient (Linear Regression)
3) Coefficient of determination
4) Test for correlation coefficient ➔ p value
5) Graph
8. Shapiro-Wilk test (Normality test) and Q-Q plot
1) Krutosis α4 (α4=3 ➔ normal distribution)
2) Shapiro-Wilk test ➔ p value
3) Q-Q plot graph
9. Chi-square test (2x2 Independence)
Yates corrected and uncorrected tests ➔ p value