How to use
By using Stats tester miniA, you can perform basic statistics tests by an easy operation. Maximal sample number is 100/group at each test. Maximum frequency for the chi-square test is 1 million.
### About the initial screen ###
[Title of statistics] button:
Tap to display the data entry/results screen for each statistics test.
[Clear Memory] button:
The input data and display results for each test are saved in the smartphone's internal memory unless you tap the [Clear] button on the test screen. This data will be recalled the next time the test is used and displayed in the input/output window. When testing with new data, the previous data is replaced with the new data.
These data are stored in memory exclusive to this app and cannot be accessed by other apps. If you want to erase all of these, tap this [Clear Memory]button.
[Help and Option] button:
After tapping this button, you can select the [How to use this app], [Glossary] or [Privacy policy] button on the next [Help and Option] screen. [Help and Option] does not have [option] functionality built in yet.
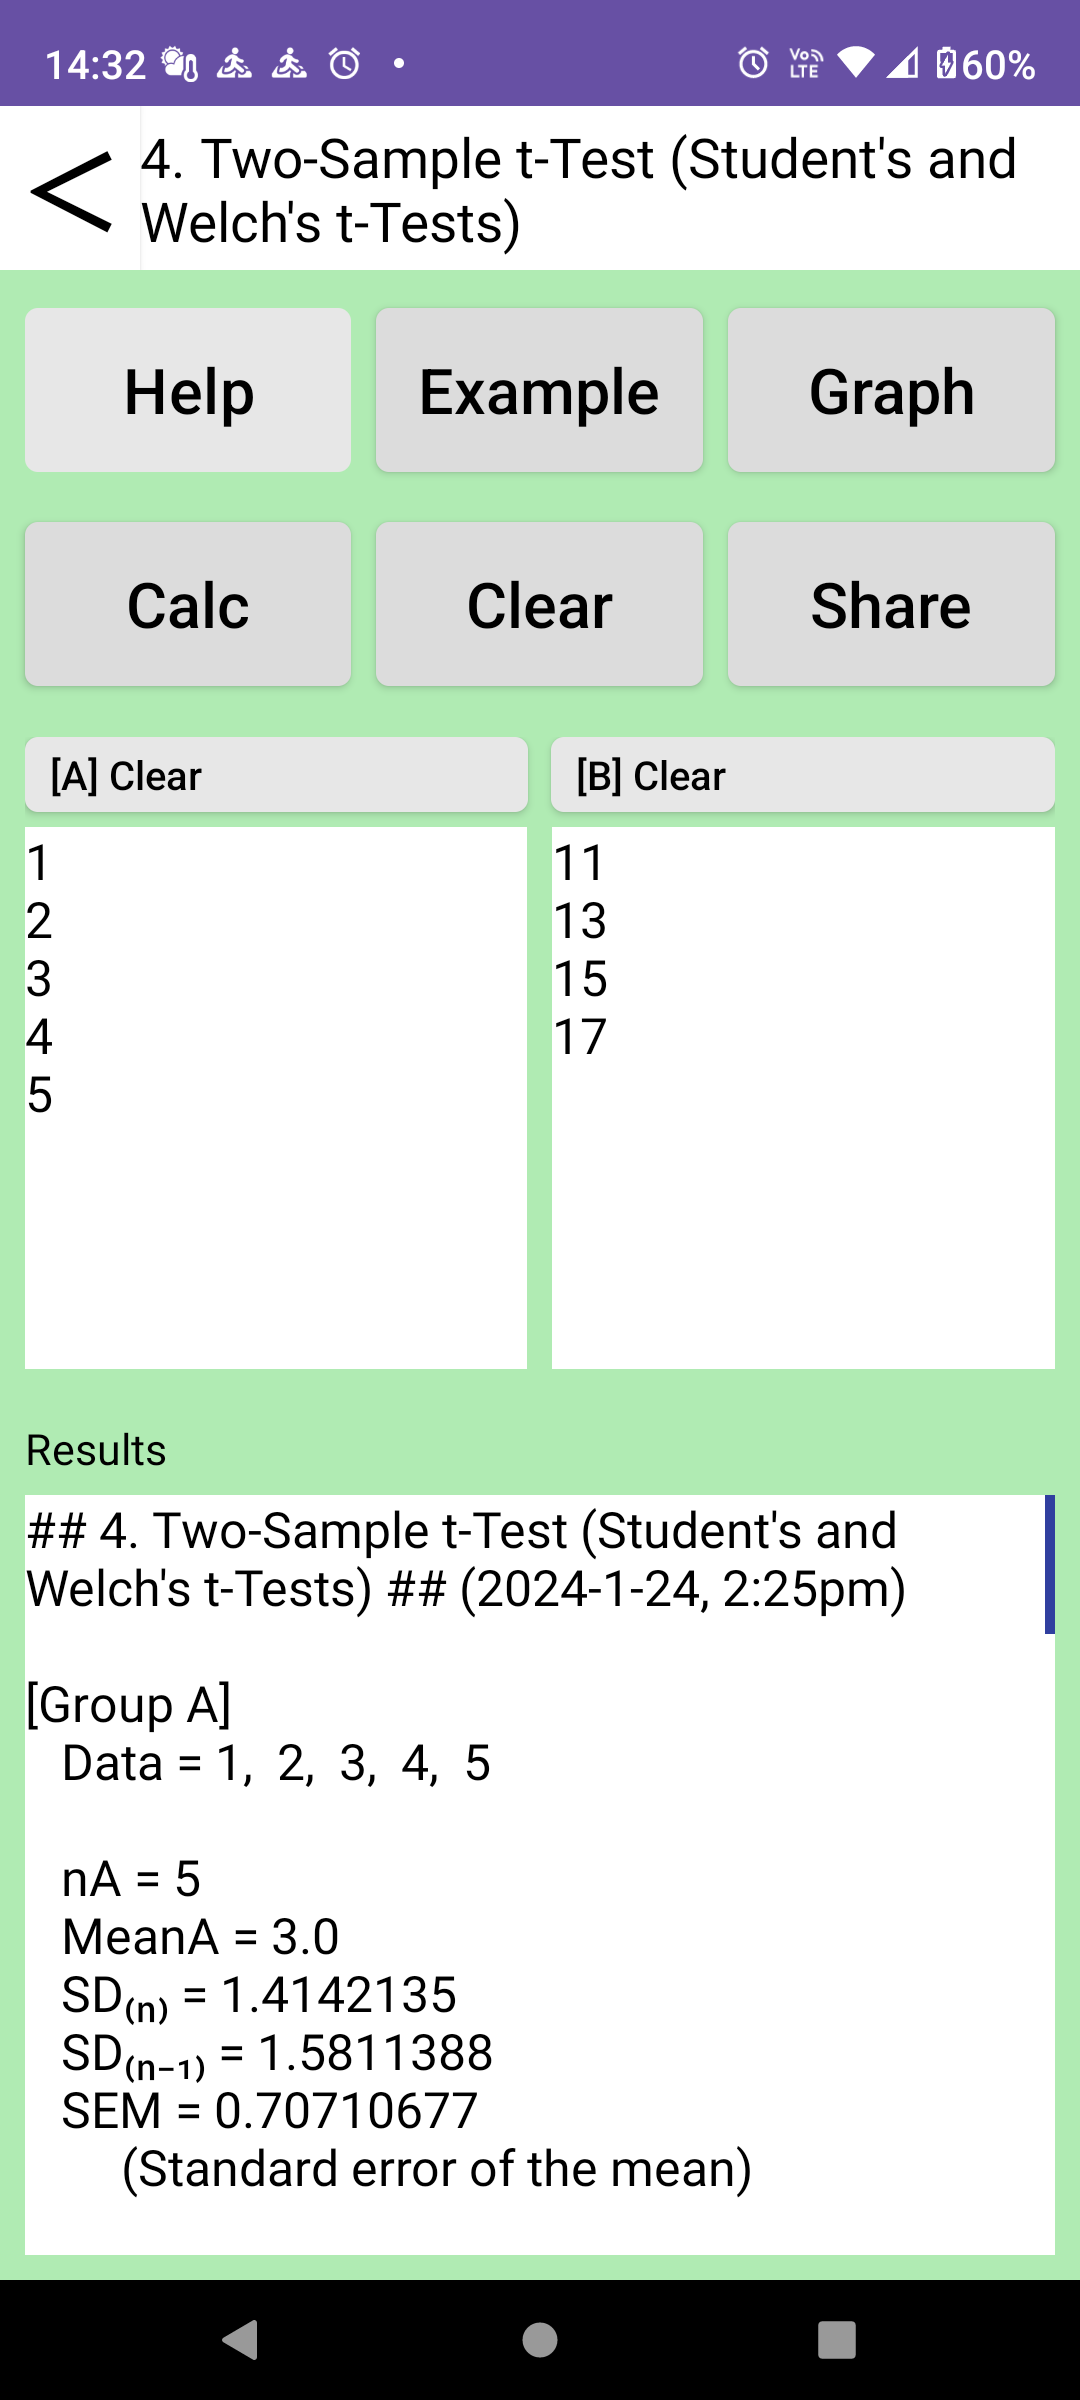
### Data entry and output screen ###
[<] button: Return to the menu page.
[Help] button: Show help for each test.
[Example] button: Enter example data.
[Graph] button: Display a graph.
[Calc] button: Perform statistics test.
Data- and result-windows are stored in the internal memory.
[Clear] button: Clear the data- and result-windows and display a hint.
[Share] button: Tap this button to copy the text on the output screen to Clipboard. If you do not need to share the results, continue by tapping the [◀︎] button on your smartphone.
--- Data window --
1. The characters that can be entered are numbers (0 to 9), decimal point, minus sign, comma, space etc.
2. Data can be ..
1) entered using a keyboard.
2) pasted from the clipboard.
3) copied to the clipboard.
Space, Comma(,) or EnterKey can be used as a delimiter for input data. For the input format for each test, please see the hint that appears after tapping the [Clear] button.
--- Result window ---
1.The result window displays the input data, calculation results (e.g. mean value, SD, etc.), and the null (Ho) and alternative (Ha) hypothesis of the test.
2. Finally, as shown in the example below, the p-value of the test result and whether or not the null hypothesis (Ho) is rejected are displayed.
p = 0.07xxxx NS (2 tails)
➡ Ho is not rejected. (When set to α=0.05 or α=0.01)
p = 0.04xxxx* (2 tails)
➡ Ho is rejected. (When set to α=0.05 or α=0.01
p = 0.003xxx** (2 tails)
➡ Ho is rejected. (When set to α=0.01)
This app uses α=0.05 or α=0.01 as the significance level, but if you have decided on a different significance level, please compare your significance level with above p-value.