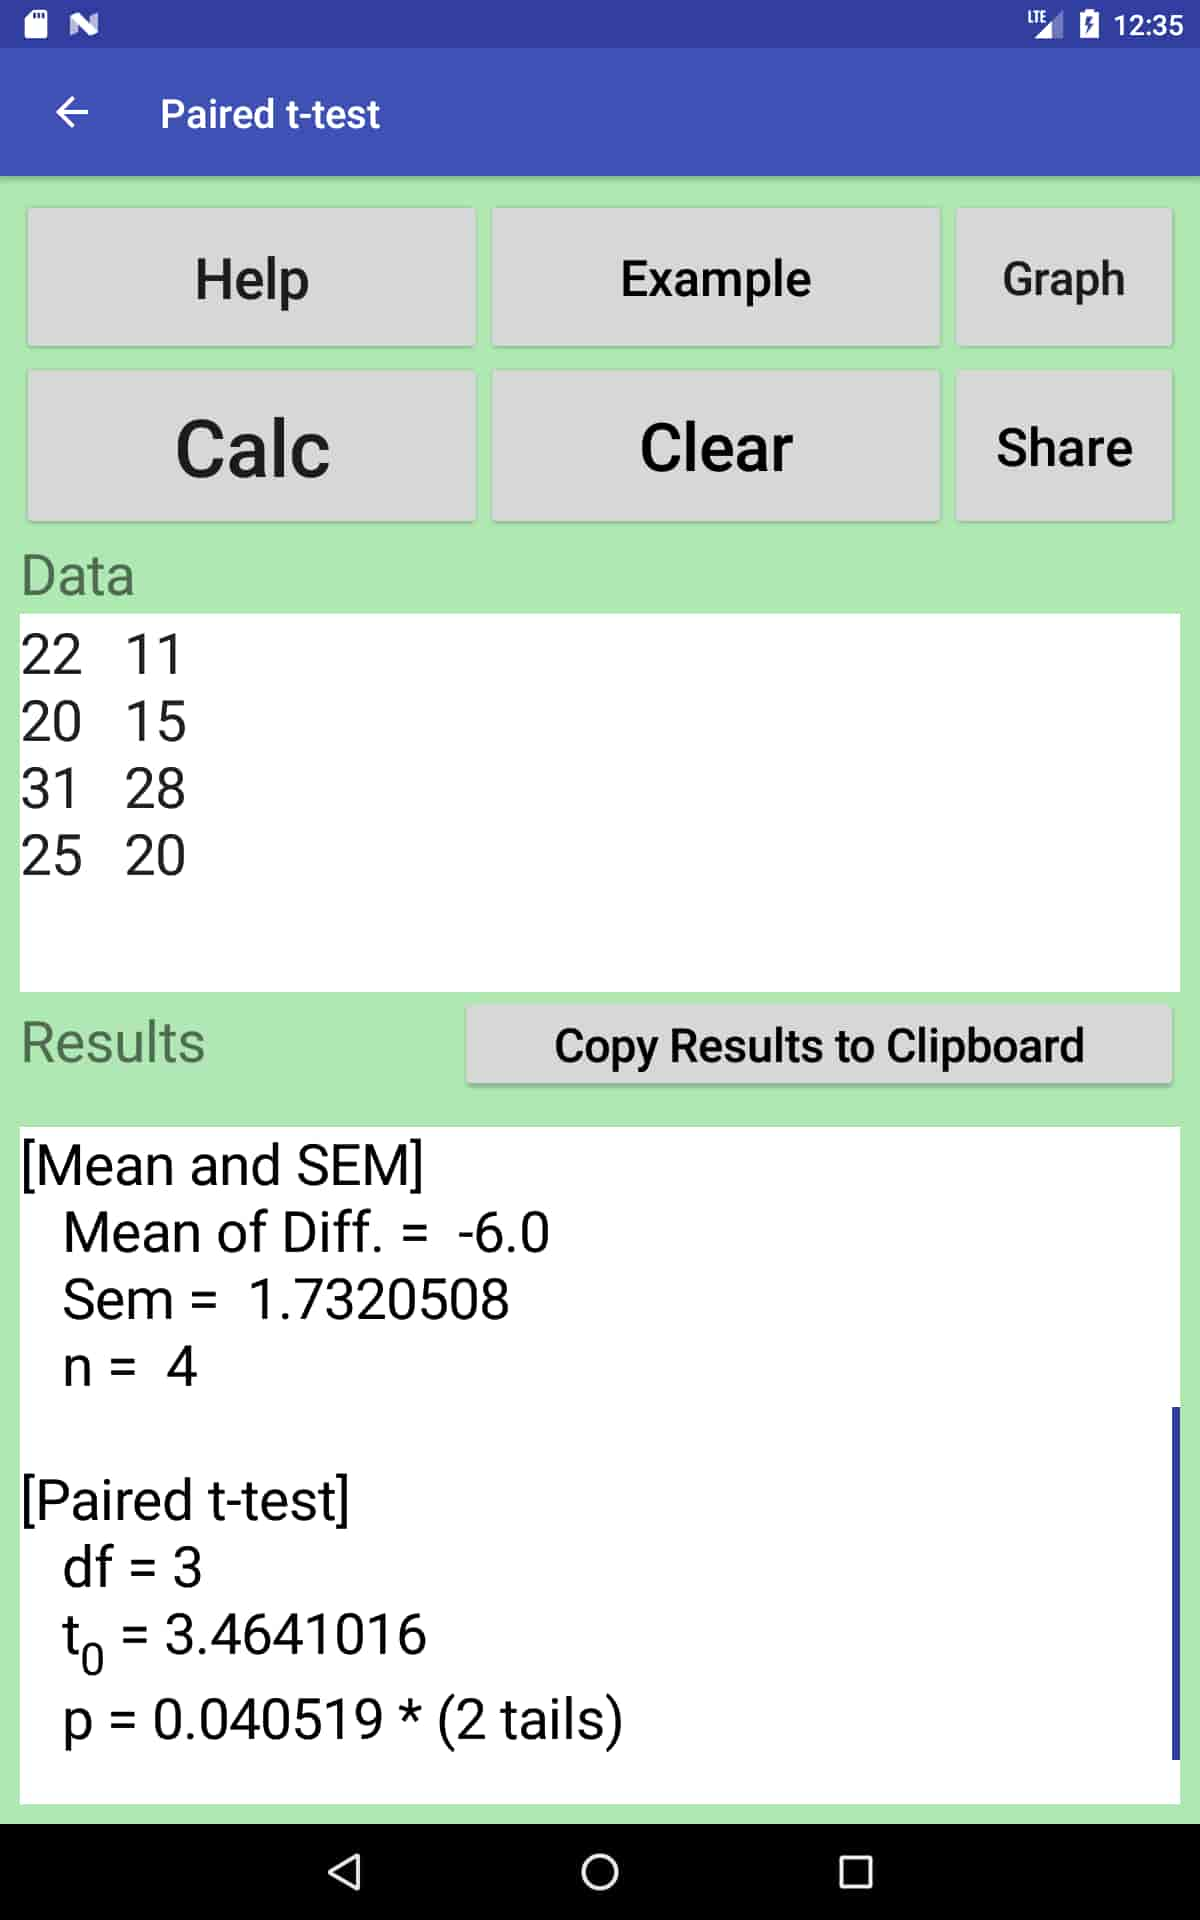
Sample of Result screen
The following is displayed in the Result window. The tapping of the [Share] button sends it to a mailer, editor, cloud, etc.
## 1. Mean, SD and SEM, etc ##
(2019-12-23, 5:39pm)
Data = 1, 2, 2.1, 2.9, 3, 3.1, 4, 3.9, 5
[Mean, SD and SEM]
Arithmetic Mean = 3.0
SD(n) = 1.1372482 (Standard Deviation)
SD(n-1) = 1.2062339 (Standard Deviation)
SEM = 0.40207794
(Standard error of the mean)
n = 9
[Confidence Interval (CI)]
95% CI : 2.0728076 --- 3.9271924
t(8, 0.05) = 2.3060
99% CI : 1.6508832 --- 4.349117
t(8, 0.01) = 3.3554
[Skewness and Kurtosis]
### > See [Help]
Skewness (g1) = 0.0
(Excel: SKEW.P function)
Skewness (G1) = 0.0
(Excel: SKEW function)
Kurtosis (α4 (= g2 + 3) ) = 2.345653
Kurtosis (g2) = -0.6543469
Kurtosis (G2) = -0.103517905
(Excel: KURT function)
[Others]
Sum = 27.0 (Sum of Data)
SS = 11.64 (Sum of Squares)
V(n) = 1.2933333 (Variance)
V(n-1) = 1.455 (Unbiased variance)
SD(n) = 1.1372482
(SD of sample group.
Excel: STDEV.P function)
SD(n-1) = 1.2062339
(SD as estimate for population.
Excel: STDEV function)
%CV = 37.90827
[Various Means]
Arithmetic Mean = 3.0
Geometric mean = 2.744539
Harmonic mean = 2.443433

